Every year we create follow up statistic which we discuss with the Core Leadership Team. How maby femails compared to men. How many costomers compared to experts and sales people and how many attended each track. In this news article you find the overall statistics.
Attendees per type
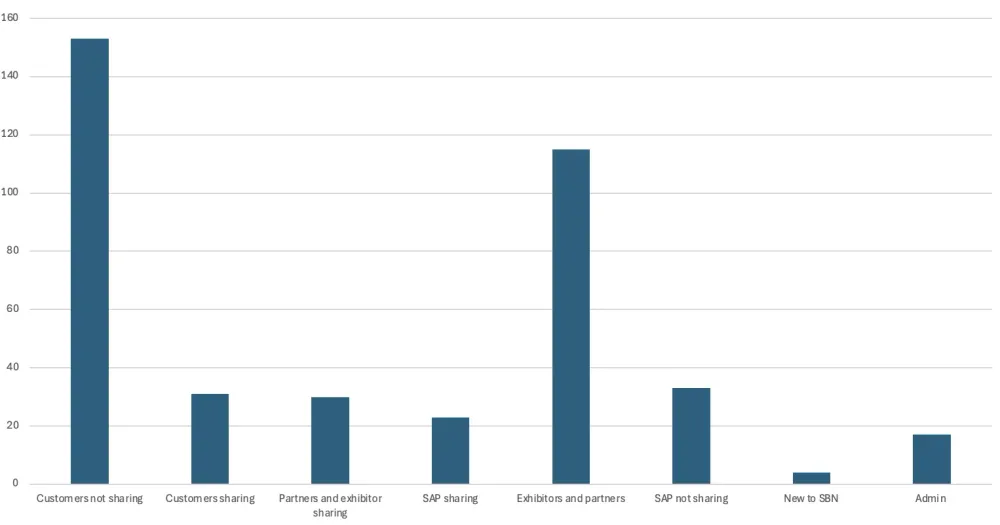
The table in clear numbers:
| Customers not sharing | 152 |
| Customers sharing | 31 |
| Partners and exhibitor sharing | 30 |
| SAP sharing | 23 |
| Exhibitors and partners | 105 |
| SAP not sharing | 33 |
| New to SBN | 4 |
| Admin | 17 |
| Total registrations | 396 |
Percentage per type of attendees
| Customers | 186 | 49% |
| Not Customers | 193 | 51% |
| (exckluded 17 admin) | 379 |
Percentage per femav
| All attendees | % | Sharing | % | |
| Female | 125 | 32% | 21 | 25% |
| Male | 271 | 68% | 63 | 75% |
| 396 | 84 |
Titels for Customers, Exhibitors, Experts, Partners and SAP
Titles are unfortunatly missing in the export file 2026.
When corrected they will be published here.
SBN Conference Survey Result
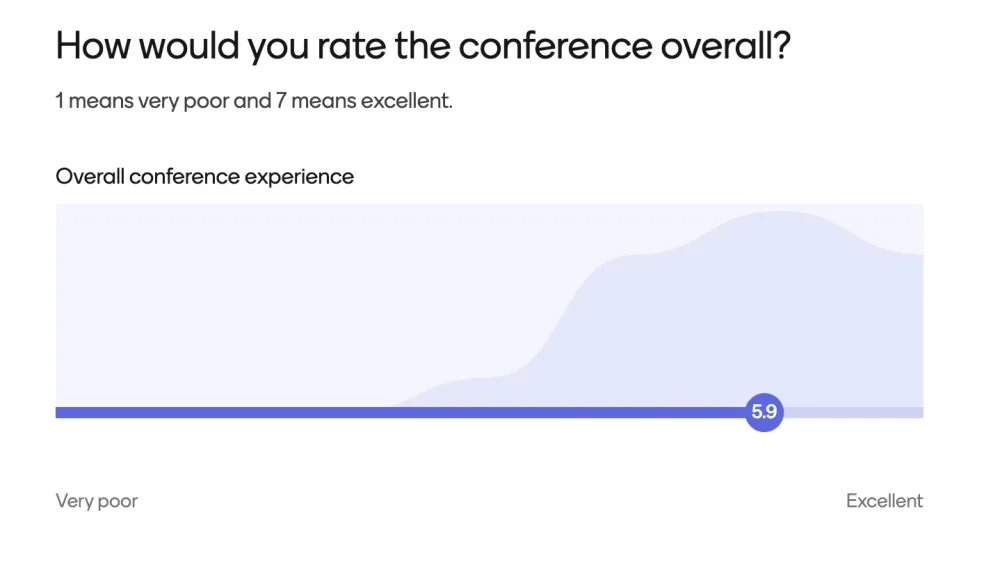
Read more about the SBN Conference Survey details and comments on this link
Presentation voter, new in 2026. Read more at this link
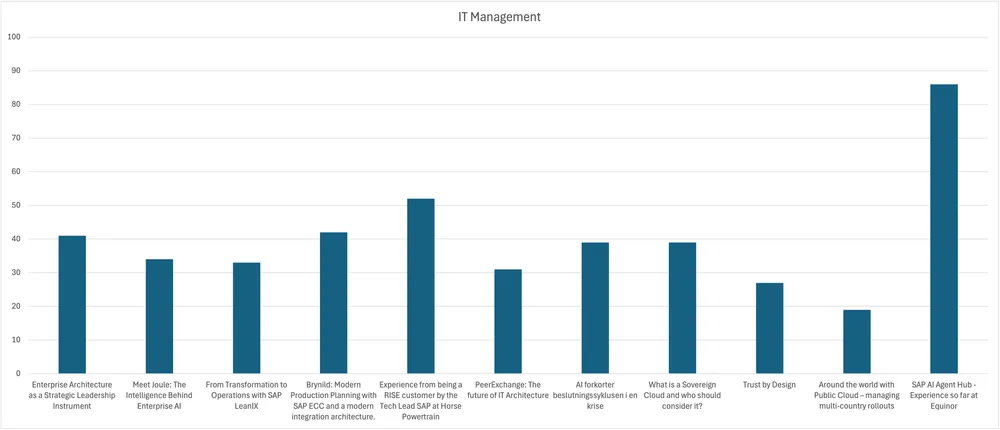
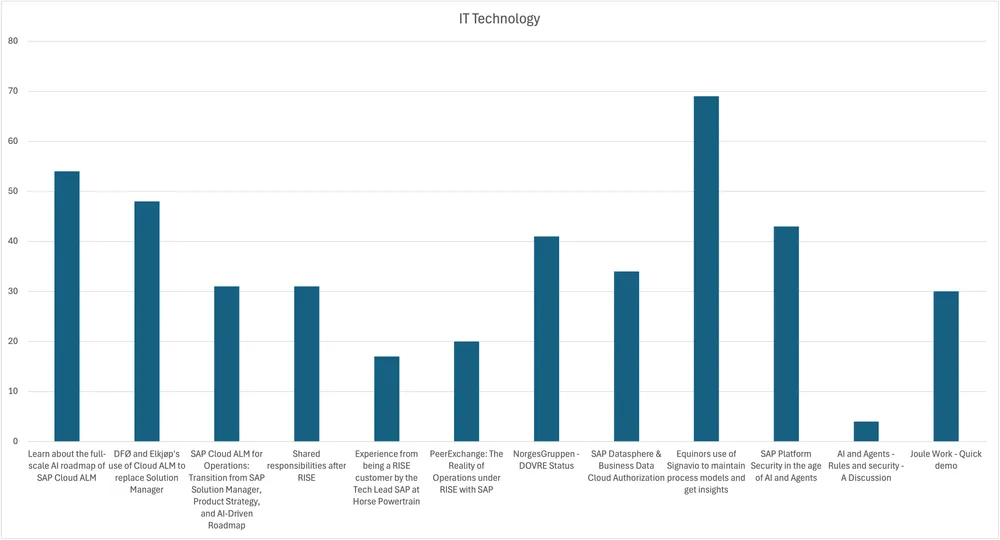
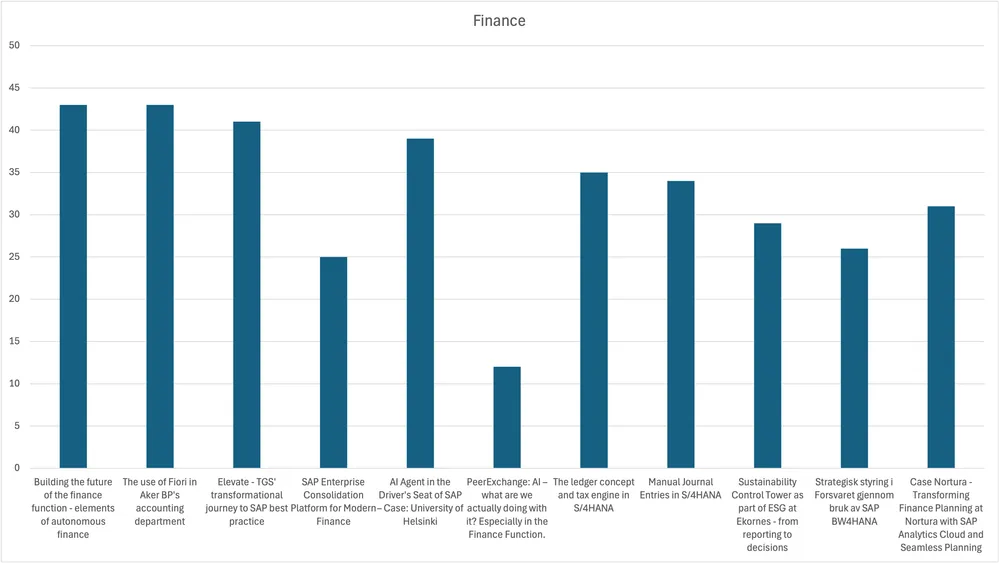
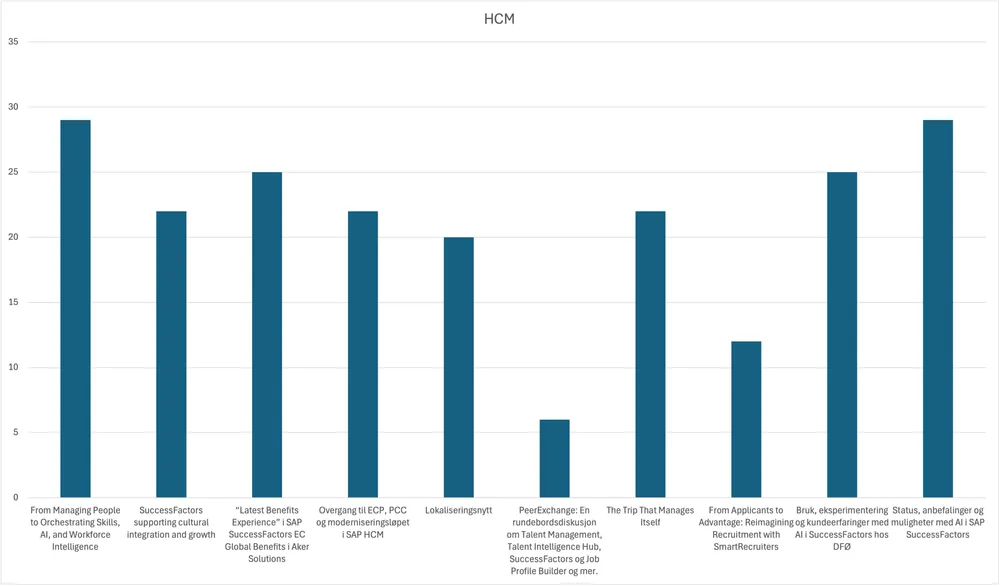
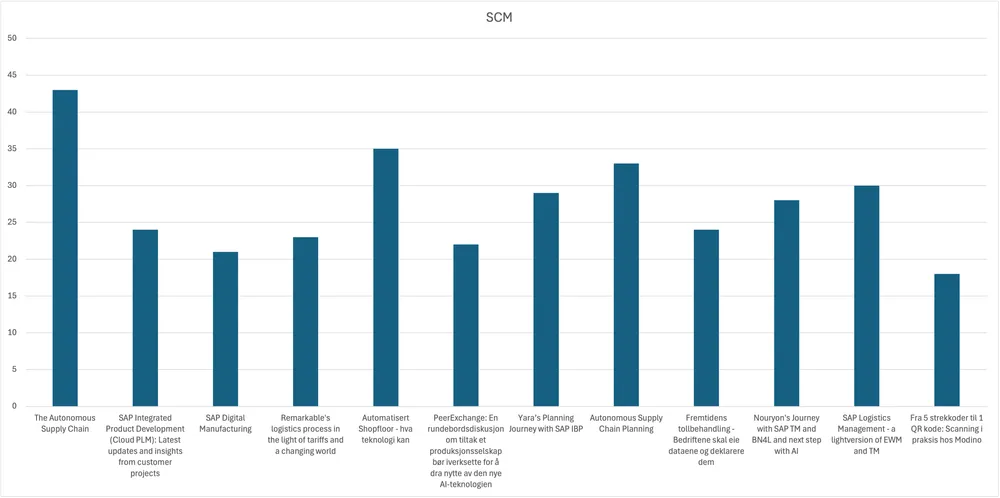
Number of attendants all tracks
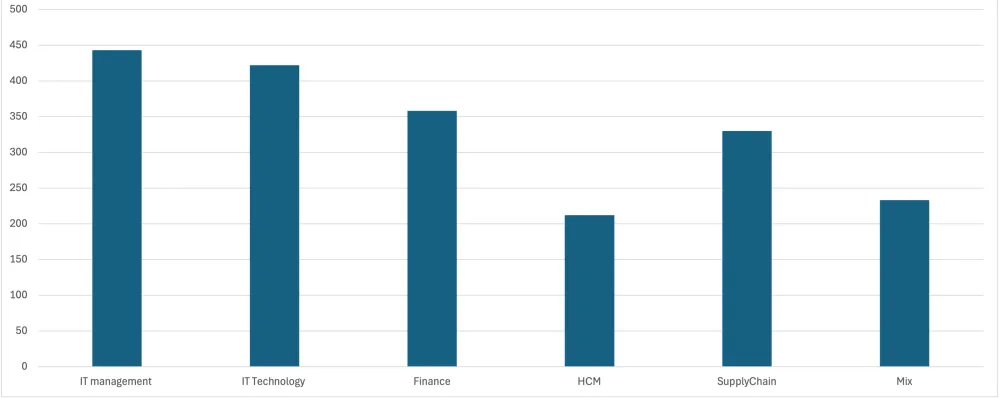
Track IT Management
Track IT Technology
Track Finance
Track HCM
Track SCM
Track Mix
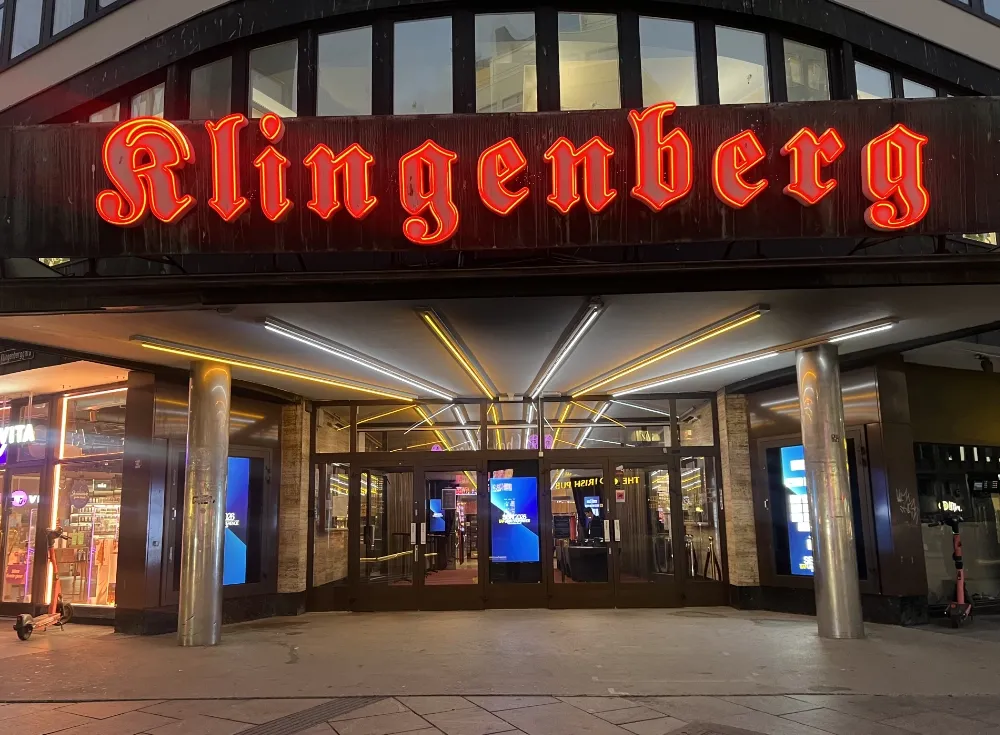
Location

Link to the SBN conference 2026 page
The SBN Conference 2026 page is now a content repository with links to Recordings and Presentations slides, Pictures and Statistics
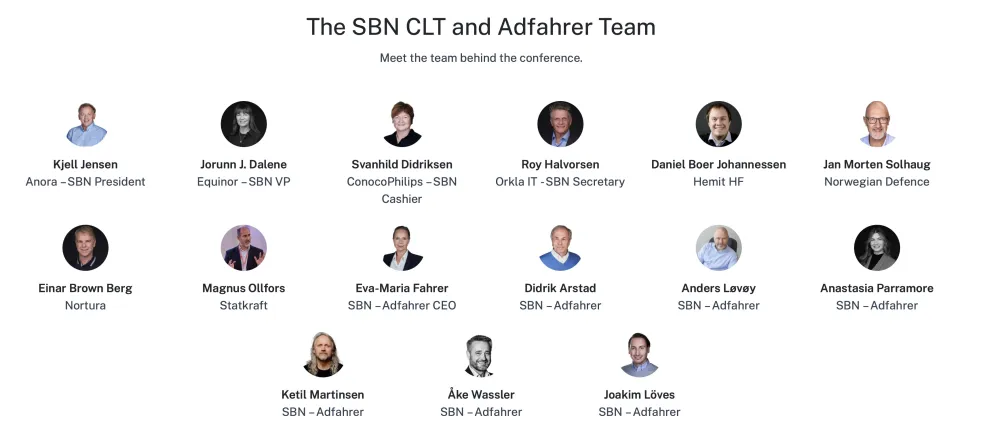
Thank you all for joining, sharing, joking, enjoying, learning, teaching, posting, sending emails and much more ...
The SBN Team trough Eva-Maria